A good influencer campaign report answers three questions on the first page: what we spent, what we got, and what we'd do next. Lead with views, reach, engagement rate and cost per view, then show the best posts, and keep everything else in the appendix.
Most reports do the opposite. They open with forty screenshots and a wall of numbers, and the client skims to the last slide looking for the one figure their boss will ask about. This guide covers which metrics to include, how to calculate them, a report structure you can copy, and how to present it so it actually gets read.
Start with what the client will be asked
Before you build a single chart, think about the conversation your client will have after the campaign. A brand manager usually has to explain the result to someone more senior, in a few sentences. Your report should hand them those sentences.
That means the summary page needs a short answer to:
Did we hit the objective in the brief? Awareness, consideration, sales or app installs. Say which one, and whether it worked.
What did it cost per result? Usually cost per view, sometimes cost per engagement.
What worked best? The top two or three posts, creators or formats, and why.
What should we change next time? One to three clear recommendations.
If the brief never stated an objective, that's the first fix for next time. Our influencer brief template shows how to write one that makes reporting easy.
The metrics that matter, with formulas
Pick one engagement-rate formula and state it in every report.
You don't need every number a platform offers. These five cover most campaigns, and they're easy for a client to understand.
Views
How many times the content was played or seen. On TikTok and Instagram Reels this is the headline number most clients look for first. Note the date you collected it, because views keep growing for days or weeks after posting.
Reach
How many unique accounts saw the content. One person watching a video three times counts as three views but one reach. Reach is only visible in the creator's own insights, so you'll need screenshots or a direct connection to get it.
Engagement rate
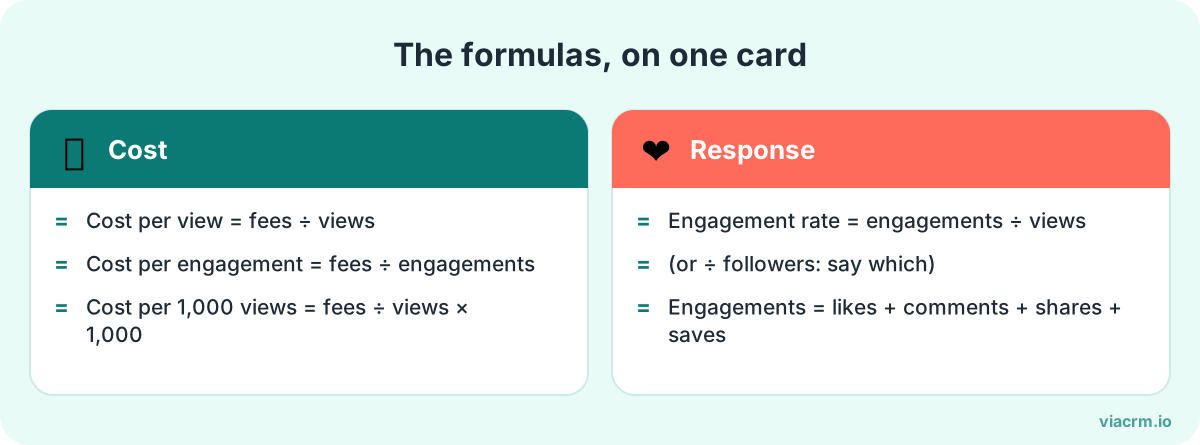
How many people did something with the post, as a share of who saw it. There's no single industry standard, so pick one formula, write it on the report, and use it every time:
Some agencies divide by reach or by follower count instead. Dividing by followers flatters creators whose posts went viral beyond their audience and penalises ones with large, quieter followings, so views or reach is usually fairer for comparing posts.
Cost per view (CPV)
What the client paid for each view. This is the number that lets a brand compare influencer spend with paid ads.
Cost per view = total creator fees ÷ total views
For example, RM 6,000 in fees and 400,000 views gives a cost per view of RM 0.015. Many teams also show cost per thousand views (multiply by 1,000, so RM 15 here), which is easier to read.
Cost per engagement (CPE)
What the client paid for each like, comment, share or save.
Cost per engagement = total creator fees ÷ total engagements
CPE is useful when the objective is conversation or community, not just reach. Decide upfront whether 'fees' includes production, product seeding and your agency fee, and say so on the report. Clients compare numbers across agencies, and an unexplained difference in method looks like a difference in results.
A report structure you can copy
This order works for most campaigns, from a five-creator product launch to a fifty-creator festive push. Keep the first two pages tight; everything detailed goes later.
Section
What goes in it
Length
1. Summary
Objective, total spend, total views, reach, engagement rate, CPV, one-line verdict
1 page
2. Highlights
Top 3 posts with thumbnails, links and why they worked
1 page
3. Results by creator
Table: creator, platform, post date, views, engagements, ER, CPV
1–2 pages
4. Results by platform or format
TikTok vs Instagram, video vs carousel, if the campaign had a mix
1 page
5. Audience feedback
Common comment themes, questions people asked, any negative feedback
Half a page
6. Learnings and next steps
What to keep, what to change, suggested budget split
Half a page
Appendix
Every post link, screenshots of insights, data collection dates, formulas used
As needed
Comment themes are often the most valuable part for the client and the most skipped. If ten people under one video asked where to buy, that tells the brand more than an engagement rate does.
Weekly updates vs the final report
Clients rarely want to wait until the end to hear how things are going. Two kinds of reporting cover it:
Weekly update
Final report
Purpose
Show progress, flag problems early
Judge the campaign and plan the next one
Format
Short message or one-page summary
Full report, usually PDF or slides
Content
Posts live so far, views to date, any delays
All metrics, highlights, learnings
When
Same day each week while posts go live
Two to four weeks after the last post
Waiting a couple of weeks after the last post before the final report gives views time to settle. Tell the client the cut-off date in advance so nobody is surprised that numbers in the final report are higher than in the last weekly update.
How to present the report to clients
A report that's emailed and never discussed is half a report. Where you can, walk the client through it:
Send the summary page a day early, so they arrive with questions instead of reading for the first time on the call.
Open with the verdict, not the method. 'We beat the cost per view target by a third' before 'here's how we calculated it'.
Show the content, not just the numbers. Play the top video. Clients approve campaigns because of the creative, and seeing it again reminds them why.
Be honest about what didn't work. A creator who underperformed, a format that flopped. Clients trust agencies that say it first.
End with a recommendation they can say yes to: the next campaign, a change in creator mix, or a budget shift.
Common reporting mistakes
Mixing formulas. Engagement rate by followers for one creator and by views for another. Pick one and state it.
No collection date. 'Views: 52,000' means little without 'as of 3 November'.
Screenshots instead of numbers. Screenshots belong in the appendix as proof. The client needs a table they can read in ten seconds.
Leaving out costs. Without fees, there's no cost per view, and without cost per view the client can't compare you with anything.
Reporting only the winners. Include every creator in the results table, even the ones you'd rather not talk about.
Inventing value. Avoid made-up 'media value' multipliers the client can't check. Stick to numbers that come from the platforms and the invoices.
Where ViaCRM fits
Most of the time in reporting goes into collecting: chasing post links, asking creators for screenshots, and copying numbers into a sheet. ViaCRM cuts most of that out.
Instagram and TikTok results are pulled automatically and updated weekly, so your weekly update is already built.
RED, Facebook and X results are entered manually in the same place, so every platform sits in one report.
Personal tracking links for each person, so you can see which posts bring in clicks, not just views.
Cost per view is calculated for you, using the fees already recorded in the campaign.
Download a client-ready PDF, or let the client see results in their own login.
Because the brief, the approved drafts, the posts and the payments live in the same campaign, the report reflects what actually happened, not what someone remembered to copy across. You can see how a campaign flows end to end on how it works.
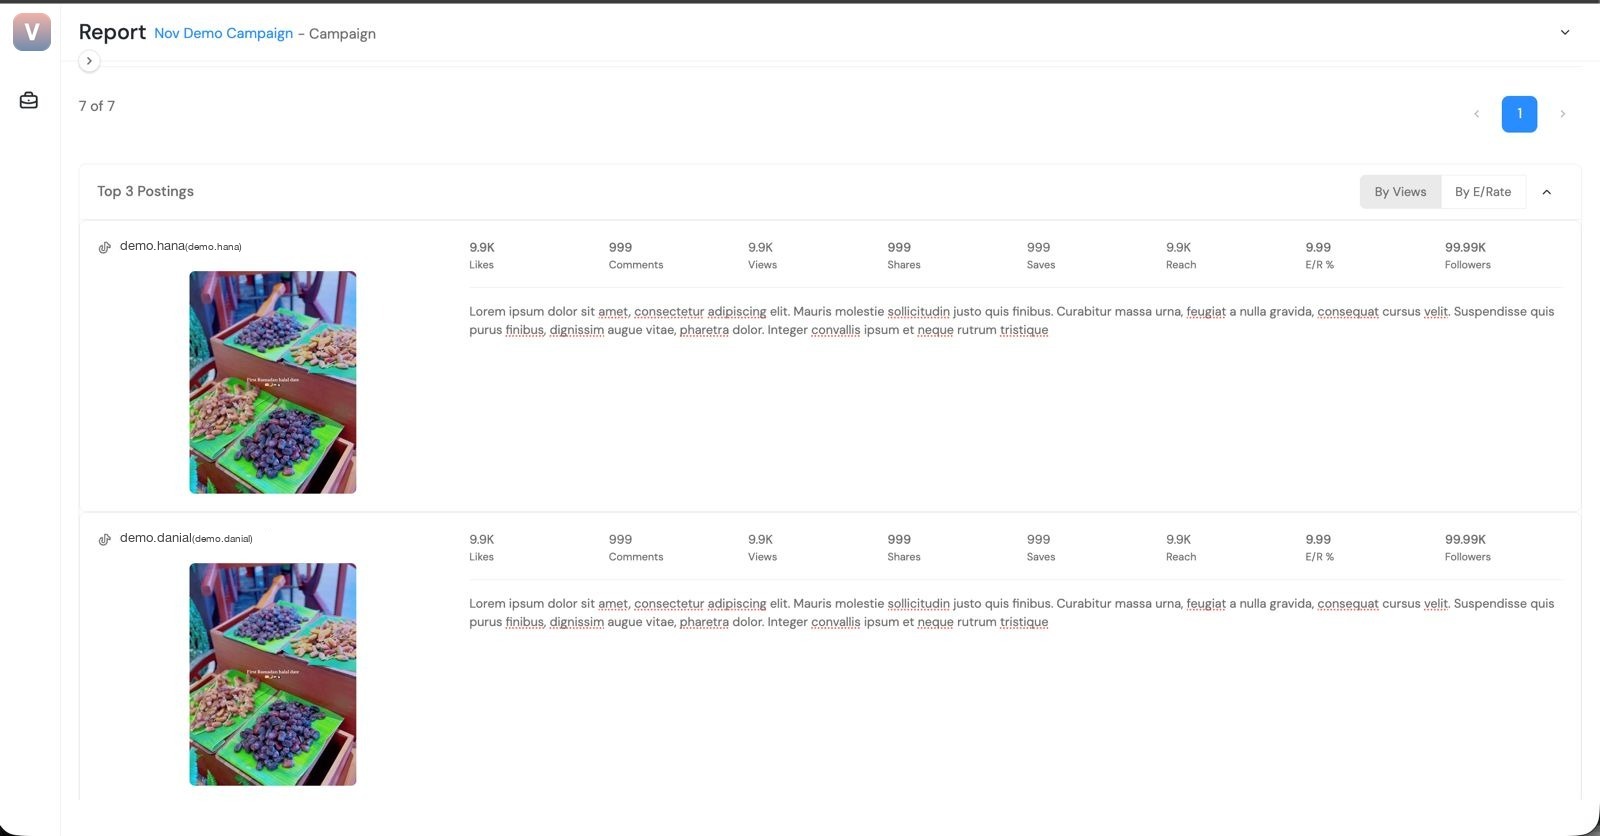
A client-ready report in ViaCRM, also downloadable as PDF.
Frequently asked questions
What should an influencer campaign report include?
A one-page summary (objective, spend, views, reach, engagement rate and cost per view), the top-performing posts, a results table by creator, audience feedback, and clear next steps. Put screenshots, post links and formulas in an appendix.
How do you calculate cost per view for influencer marketing?
Divide the total creator fees by the total views. For example, RM 6,000 in fees and 400,000 views is RM 0.015 per view, or RM 15 per thousand views. State whether your fees include production and agency costs.
What is a good engagement rate for influencer posts?
It depends on the platform, the content format and the formula you use, so a single benchmark can mislead. Compare creators within the same campaign using the same formula, and track your own results over time to set realistic targets.
When should I send the final influencer campaign report?
Usually two to four weeks after the last post goes live, so views have time to settle. Send short weekly updates while the campaign is running, and agree the data cut-off date with the client in advance.
Run your first campaign free
Brief, approve, track and report on your influencer campaigns in one place, with client-ready PDF reports.
What influencer campaign management software does, how it differs from discovery tools, and a checklist and vendor questions to help you choose the right one.
How to write an influencer brief that gets good drafts first time, with a free template covering deliverables, dates, do's and don'ts, keywords and disclaimers.
How influencer agencies manage multiple clients at once: separate workspaces, client logins, two-layer approvals, per-client reporting, billing and team roles.